Agricultural risk intelligence for lenders, investors, and supply chains
Originate smarter. Monitor continuously. Manage portfolio risk with confidence. Plot-level credit scores, yield forecasts, and climate-adjusted analytics — for any crop, anywhere.

Trusted by banks, investors, and agribusinesses





Built for your role
- Plot-level credit scoring for agricultural loan origination
- Continuous portfolio monitoring without additional field visits
- Early warning alerts for loans at risk of default
- Climate scenario modelling for long-term exposure
- Compliance-ready risk reports
- Due diligence intelligence on agricultural assets and portfolios
- Weekly yield forecasts from flowering to harvest
- Climate change impact modelling by crop and geography
- Comparable-field benchmarking for fair valuation
- Supplier reliability assessment at field level
- Forward crop volume estimates by region and variety
- Quality risk monitoring via satellite health indices
- Origin traceability support
How it works


Portfolio intelligence on WhatsApp
Check a plot's risk score, alerts or yield outlook from anywhere. Our AI assistant answers on WhatsApp using your portfolio data.
- Plot scores and alerts on demand
- Early warnings delivered instantly
- Plain-language answers, no dashboard needed
Registered users get access to the AI assistant. Send us a WhatsApp message to register.
Register now via WhatsApp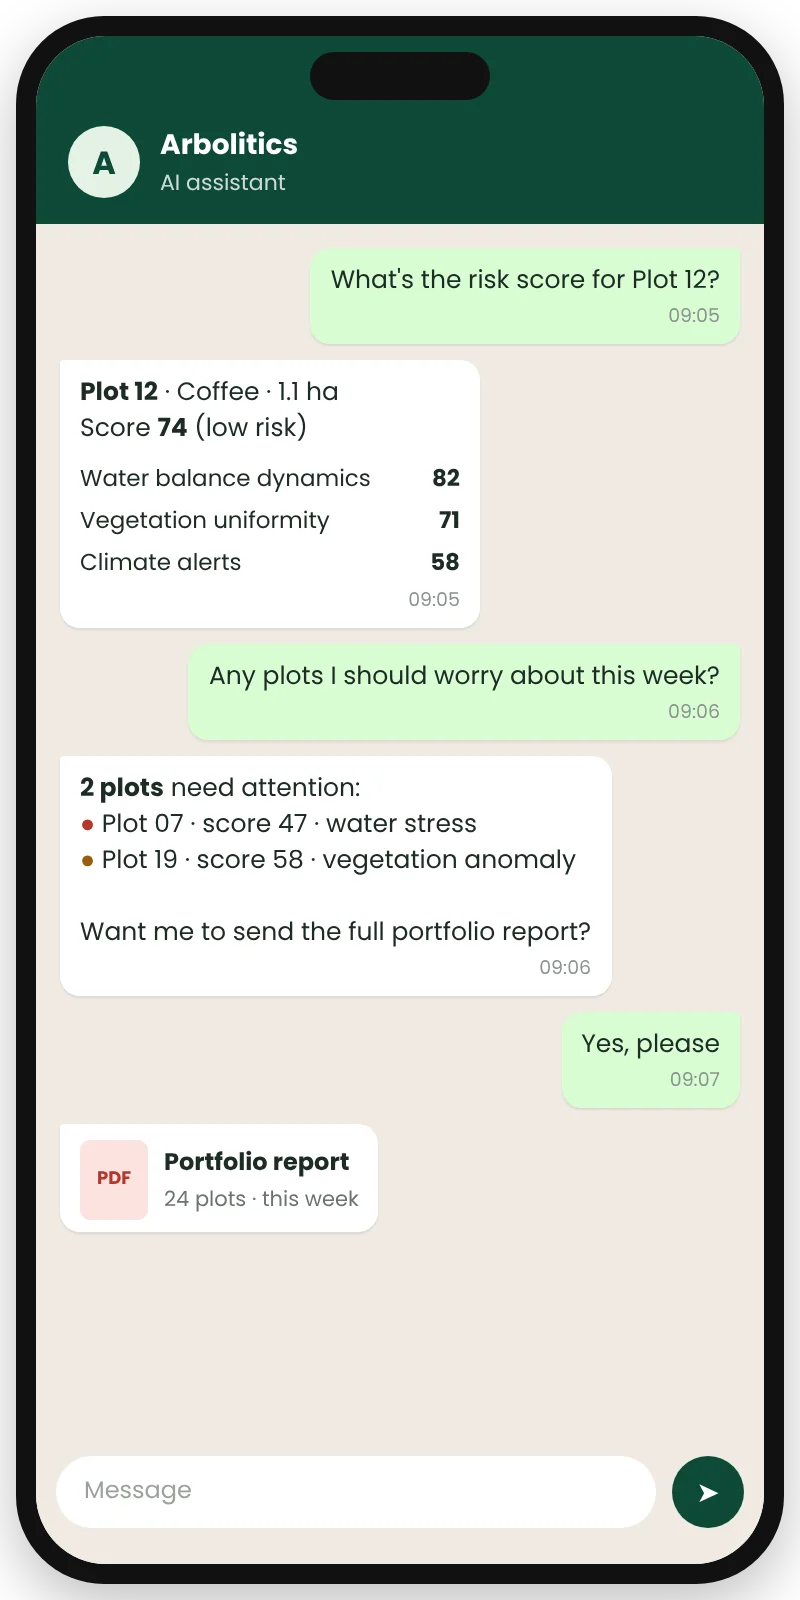
Case studies
Microfinance bank
Used satellite scoring to expand credit access while reducing defaults.
Read case studySolutions
Credit Scoring
Credit risk scoring for agricultural loan origination.
Portfolio Risk
Climate-adjusted risk analytics across your book.
Yield Intelligence
Weekly crop yield forecasts, from flowering to harvest, for lending decisions.
Insurance
Plot-level risk assessment to support product design.
Supply Chain
Supplier assessment, volume forecasts, and quality risk monitoring.